Calcbench
Calcbench
Calcbench is a great tool that allows its users to obtain quantitative and textual data from SEC filings.
Calcbench's API client makes it very easy to communicate with the database, compile data, and process it in Python.
The following lines of code import the Calcbench package and a few others necessary for analysis:
!pip install calcbench-api-client==5.1.3
import calcbench as cb
import pandas as pd
import numpy as np
The following creates a list of S&P 500 companies:
sp500_companies = cb.tickers(index = "SP500")We then collect data on current assets and current liabilities for S&P 500 companies:
acct_data = cb.standardized_data(company_identifiers = sp500_companies, metrics = ['CurrentAssets', 'CurrentLiabilities'], start_year = 2010, end_year = 2021, period_type = "Annual")Calculate the current ratio for S&P 500 companies and do some data cleaning:
# Calculate current ratios.
acct_data['CurrentRatio'] = acct_data["CurrentAssets"] / acct_data["CurrentLiabilities"]
# Replace current ratio values that equal infinity with missing.
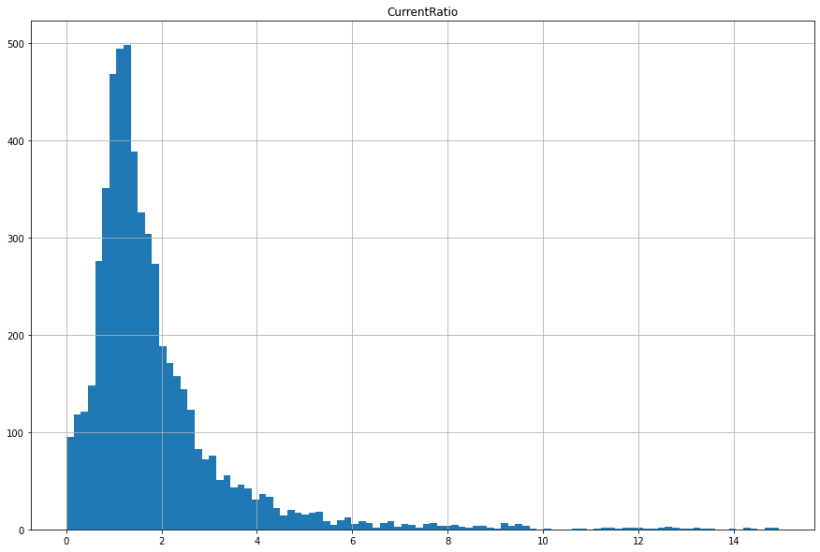
acct_data.loc[(acct_data['CurrentRatio'] == np.inf),'CurrentRatio'] = np.nanAnd below we visualize the Current Ratio using a histogram.
acct_data[(acct_data['CurrentRatio'] <= 15) & (acct_data['CurrentRatio'] >= 0)].hist(column = 'CurrentRatio', bins = 100, figsize = (15, 10))Here is the output: